Analysis and visualization#
We have developed a python package that contains a set of functions and a web-based app for analysis of FED3Bandit data and for data visualization. For the API, please see the fed3bandit API section. On the Data Analysis Pipelines section you can find examples on how to use these functions to analyze and visualize FED3Bandit data.
Installation#
Detailed instructions#
These instructions assume that you are using the Anaconda distribution of python:
Open Anaconda prompt (Windows) or terminal (MacOS/Linxux)
Type:
conda create --name fed3bandit python=3.10. This creates a brand new conda environment wherefed3banditwill be installedWhen prompt outputs:
Proceed ([y]/n)?typeyWhen everything is finished type:
conda activate fed3bandit. This will activate thefed3banditenvironment. You should see(fed3bandit)in the new line.Type:
conda install pipand typeyif promptedType:
pip install fed3banditand typeyif prompted.
Installation using pip#
The fed3 python package can be installed using pip.
pip install fed3bandit
Testing the Installation#
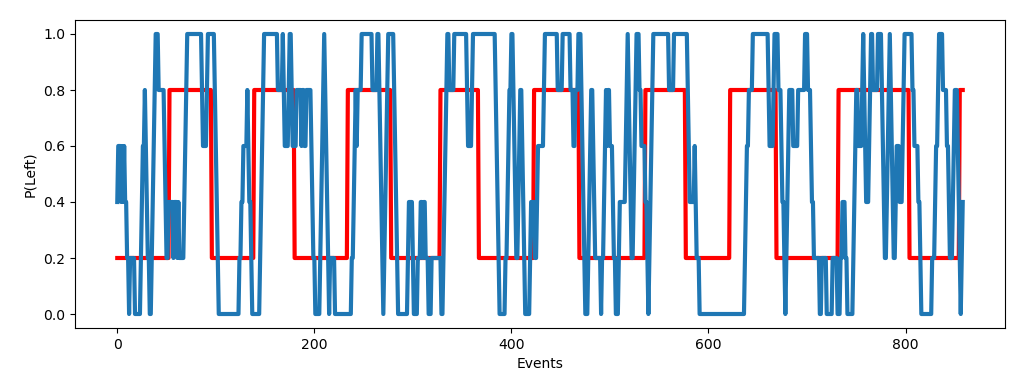
To test the installation, open a new python file, and execute the following code.
import fed3bandit as f3b
import matplotlib.pyplot as plt
import pandas as pd
import numpy as np

#load sample data
sample_data = f3b.load_sampledata()

#Get the true left reward probability as well as the mouse estimation
true_left = f3b.true_probs(sample_data, offset=5)[0]
mouse_left = f3b.binned_paction(sample_data, window=5)

#Plotting
fig, ax = plt.subplots(figsize=(12,4))
ax.plot(np.arange(len(left_probs)), left_probs, c="red", linewidth=3)
ax.plot(np.arange(len(left_probs)), binned_actions, linewidth=3)
ax.set_ylabel("P(Left)")
ax.set_xlabel("Events")
plt.show()
If everything works correctly, this should be the ouptut:
Testing the web-app#
To run and test the web-app please see fed3bandit web-app