Output Data#
FED3Bandit uses a slightly modified version of the regular FED3Bandit. Here we will go over the output of FED3Bandit. We will also show some examples of what analysis of these data will look like.
CSV file description#
FED3 saves data as .csv files. Here is what a FE3Bandit output .csv file looks like.
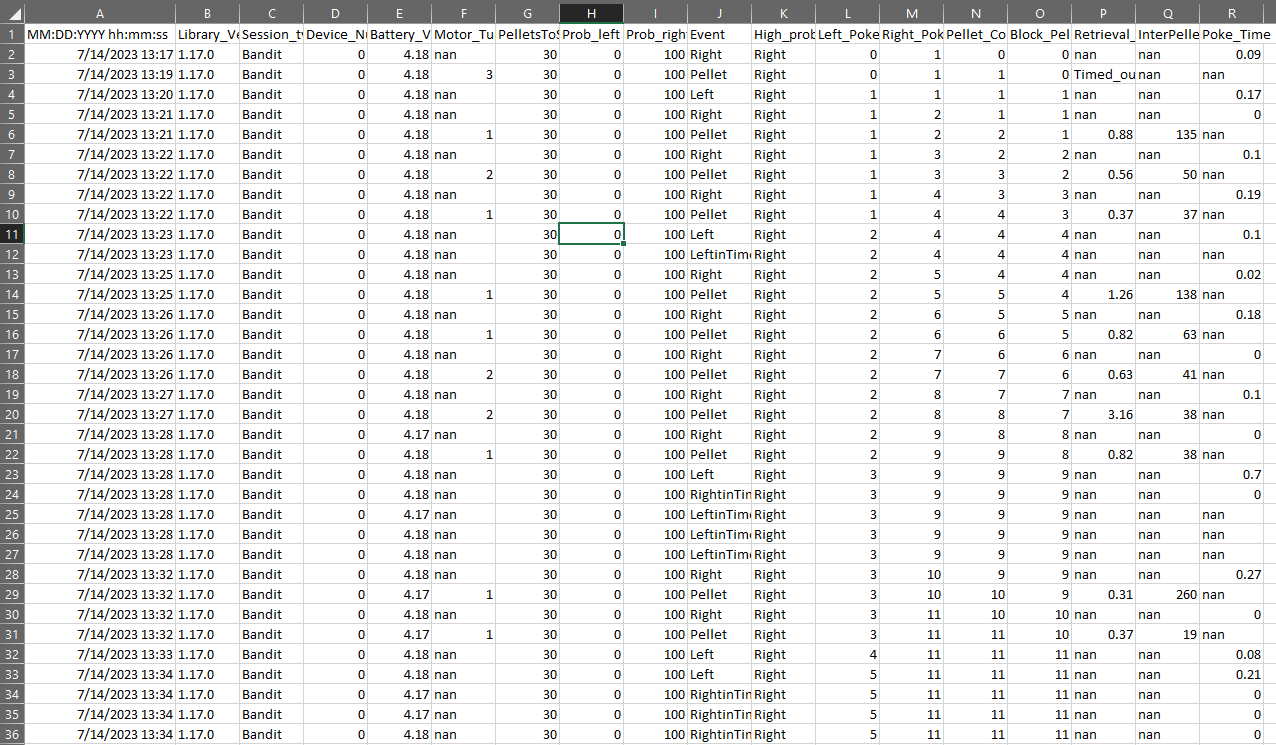
FED3Bandit .csv files are composed of the following 15 columns:
MM:DD:YYYY hh:mm:ss - Date and time when the event occurred (see 8.)
Library_Version - Version of FED3Bandit Library_Version
Prob_left - Probability of pellet delivery upon a “Left” event
Prob_right - Probability of pellet delivery upon a “Right” event
Battery_voltage
Motor_Turns - Number of turns needed to deliver a pellet after a “Pellet” event.
Pellets_to_switch - Number of pellets required to end a block
- Event - Type of event:
Left - Successful poke on the left port
Right - Successful poke on the right port
Pellet - Pellet delivery (event is registed when pellet touches the pellet well)
LeftinTimeout - Poke on left port during timeout period
LeftShort - Poke on left port that does not reach poke duration threshold
LeftWithPellet - Poke on left pork while there is a pellet in pellet well
LeftDuringDispense - Poke on left port while the pellet is being dispensed
RightinTimeout - Poke on right port during timeout period
RightShort - Poke on right port that does not reach poke duration threshold
RightWithPellet - Poke on right pork while there is a pellet in pellet well
RightDuringDispense - Poke on right port while the pellet is being dispensed
High_prob_poke - Port side that has the higher probability of delivering a pellet. If probability is equal on both sides, the output will be “nan”
Left_Poke_Count - Total number of left pokes since session start (see NOTE)
Right_Poke_Count - Total number of left pokes since session start (see NOTE)
Pellet_Count - Total number of pellets delivers since session start
Retrieval_Time - How long (in seconds) it took rodent to retrieve in pellet after it was dispensed. If event is different to “Pellet”, then output is “nan”
InterPelletInterval - Time interval (in seconds) between the last to “Pellet” events. If event is different to “Pellet”, then output is “nan”
Poke_Time - Time length of any left or right poke (including unsuccessful). If event does not contain “Right” or “Left” in its name, then output is nan.
Example Data#
In this section, we will use a CSV file to plot the behavior of a mouse and to analyze its learning behavior. This analysis was done using Python, and particularly, the Analysis and visualization tools developed for FED3Bandit.
We can first visualize the pokes (1 if Left poke 0 if right poke) and the probability of receiving a
food pellet after a left poke (prob_left). Note that in this task, the probability of receiving a
pellet after a right poke is 1- prob_left so plotting it is not crucial.

Note that at first glance it seems like there are more left pokes when prob_left=0.8 and fewer when
prob_left=0.2. However, to better visualize this, we can re-plot the data using a running mean of
pokes, which will give us the probability of poking left in a specific window:

Here we can see more clearly how the probability of a left poke increases when prob_left=0.8 and decreases
when prob_left=0.2.
We can also quantify the number of pokes and pellets:

We can also look into learning strategies, such as “win-stay” and “lose-shift” behavior:
These are only a couple examples of the metrics that can be extracted from FED3Bandit CSV file. For a more comprehensive list of analyses that can be performed on the CSVs files using the analysis tools we have developed, see Analysis and visualization and Data Analysis Pipelines